
Canvas, recenly added to Pipeline Pilot Reporting Collection allows you to draw complex charts and graphics from a set primary components to draw shapes, lines, etc.
From now on, you can use Canvas to draw your Pharmacophore Graphs (joint PNG file) overlaid on the original molecule. Furthermore, Canvas let you set tooltips, links and protocol link to each shape, therefore nodes!
Canvas for Pharmacophore Graph is available in version 1.0.1 (free upgrade), ask support@discngine.com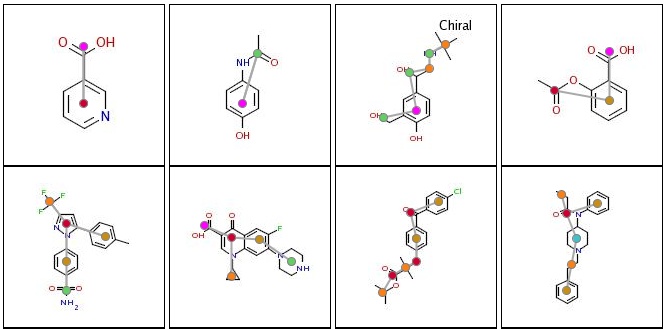
