
Hi,
During the last European UGM, I presented how to manipulate generic data graphs within Pipeline Pilot, one of the example shown was to display a compound similarity network using PP, find path, extract neighbors, etc. (Slides are available on Accelrys web site). In the network, nodes were defined by compounds and edges by compound similarity coeffients. Nodes were represented either by their molecular structure, or their target profile (activities on several targets, see picture).
Since many attendies asked for the "Slice Chart" Canvas code that I used to display the target profile, I'm sharing that code with you. The component takes three data column for each compound (Target name, log(1/IC50), Target class) and should be run to completion.
Happy New Year,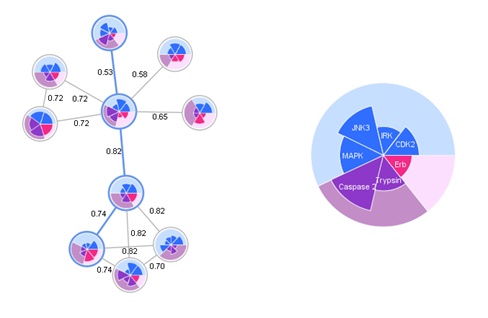
