
Hi,
I'm trying to implment a protocol to draw very basic charts(see attached .png).
I can't remember the exact name of these kind of charts but basically, it represent the mean and error bars.
Is there a way / component to draw them directly ?
I also joined a dataset as example.
Thanks a lot,
Regards
EDIT; just forgot the data![Frowner]() csv)
csv)
Patient 1,Patient 2,Patient 6,Patient 7
0.733,0.597,1.717,1.2
0.532,0.611,1.835,1.028
0.724,0.756,1.918,0.824
0.571,0.784,1.951,1.081
0.65,0.64,1.677,1.418
0.563,0.485,1.822,0.964
0.662,0.688,1.962,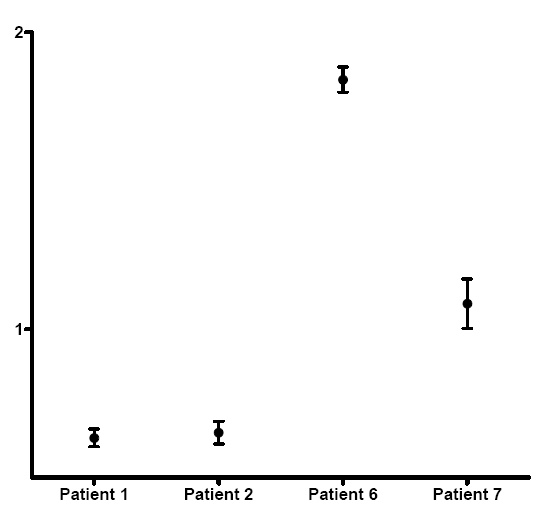
I'm trying to implment a protocol to draw very basic charts(see attached .png).
I can't remember the exact name of these kind of charts but basically, it represent the mean and error bars.
Is there a way / component to draw them directly ?
I also joined a dataset as example.
Thanks a lot,
Regards
EDIT; just forgot the data
Patient 1,Patient 2,Patient 6,Patient 7
0.733,0.597,1.717,1.2
0.532,0.611,1.835,1.028
0.724,0.756,1.918,0.824
0.571,0.784,1.951,1.081
0.65,0.64,1.677,1.418
0.563,0.485,1.822,0.964
0.662,0.688,1.962,
