
Hello,
I have a bar chart that displays the 'Number of Issues' reported for a given 'Test Method' (see mock up in the attachment). However, each issue has a sub-category classification (e.g. system suitability failure or standard preparation) that i would like to display. What i can't work out is how to do this on the chart.
Any help/advice would be greatly appreciated,
Thanks, Darren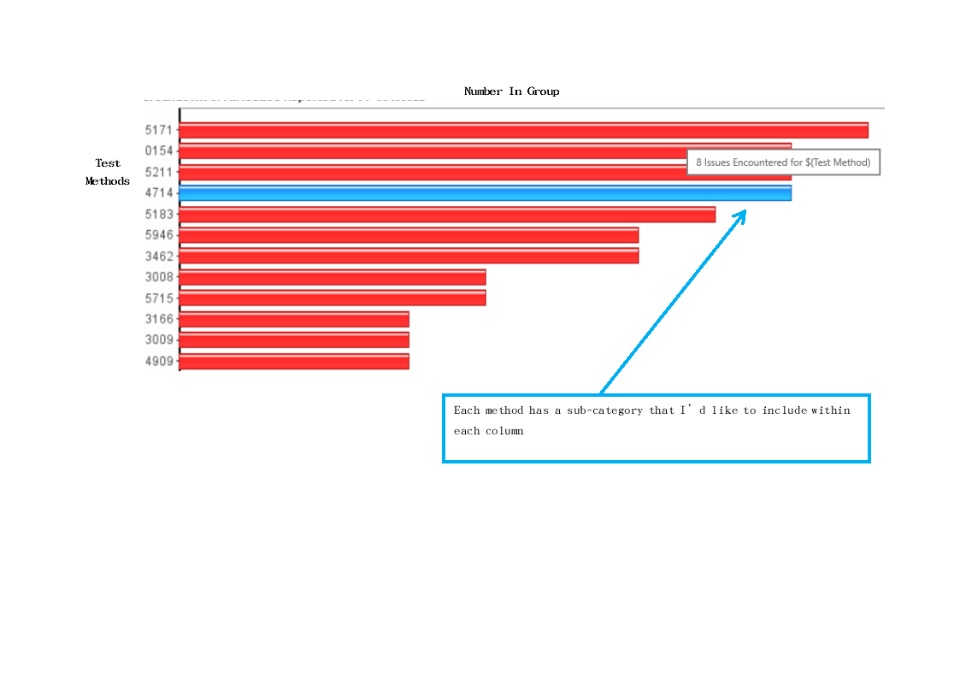
