
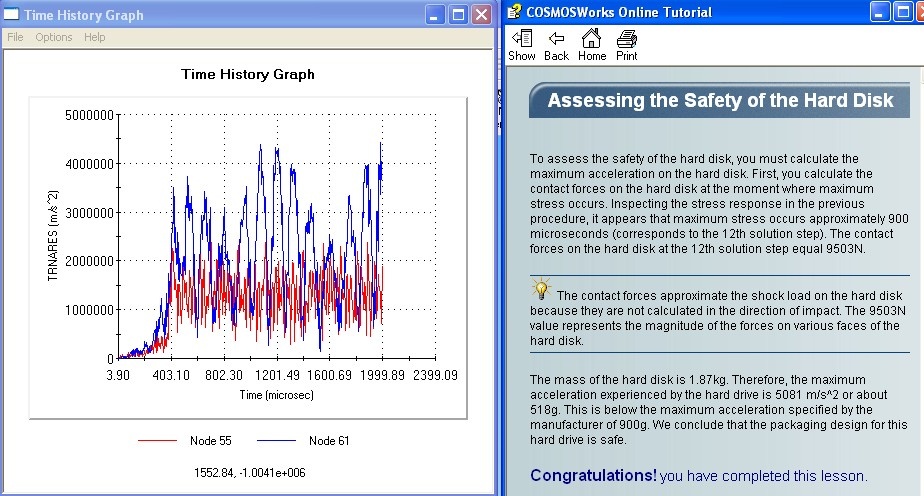
I'm working with "Drop Test - Computer Hard Disk "tutorial(CSOSMOSWorks 2007). I followed all steps to the letterand theresults are exactly the same as shown in tutorial includingTimeHistory Plot for von Mises stress at selected vertexes - onfinalstep this plot is used to estimate maximumacceleration(~5081m/s^2). Then I tried to create Time History PlotforAcceleration and that's where I encountered very weird problem:theacceleration plot looks absolutely incorrect shape-wise (sawtoothcurve instead of some kind of "bell-shaped" curve)andmagnitude-wise (the max value according to the plot reaches4500000m/s^2 (!!!))
I would really appreciate any ideas/explanations/settingstocheck.
Thank you. (i've attached the image of acceleration plot)
Dennis.


I would really appreciate any ideas/explanations/settingstocheck.
Thank you. (i've attached the image of acceleration plot)
Dennis.
SolidworksSimulation
