
I'm doing a thermal simulation on a piston in a cylinderlooking for clearances throughout operating temperatures. I startedwith a thermal simulation with the piston and cylinder at high tempand let them cool with very low bulk ambient temp convection toair. I fed those results into a static study to calculate stress,strain, displacement at one point during the cool down.
I made a graph that allows me to select from a few differentresults:
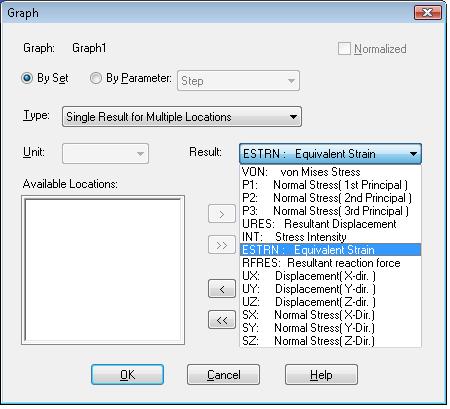
Is there a way I can create a graph of the diameter of the piston,instead of one of the results shown in the above pull down menu?
ThanksSolidworksSimulation
I made a graph that allows me to select from a few differentresults:
Is there a way I can create a graph of the diameter of the piston,instead of one of the results shown in the above pull down menu?
ThanksSolidworksSimulation
